Re-designing Credit Karma’s Most Used Surface
The Challenge
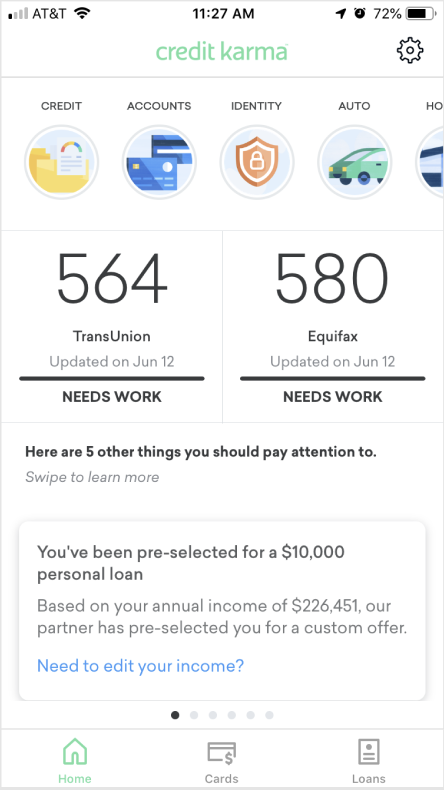
Millions of users trust Credit Karma with their financial information, but when they come to the product they are only able to find their credit scores and credit cards that they’re likely to get. They couldn’t find many of the tools and features designed to help them make financial progress. The navigation was overwhelming and not intuitive. Our objective was to help users coming to learn about their credit score find more ways to make financial progress without compromising existing revenue.
My Role
Led product design and content strategy to improve discoverability and engagement using artificial intelligence to personalize user experiences.
Led design of a publishing system so Product Managers could develop and ship content relevant to users.
Developed a structured navigation system aligned with user intent and product priorities.
Developed a content delivery system with data scientists using content models and strategy.
Process
Worked with researchers to conduct user research to understand browsing behaviors, user expectations, and friction points.
Iterated on information architecture, creating a scalable interface that surfaced a feed of highly personalized features and products.
Developed content models to accommodate various types of engagements.
Worked with data scientists and analysts to generate a system to deliver only the most appropriate content to the right users.
Designed and shipped a content creation tool for individual verticals to be able to publish their content to the system.
Facilitated cross-functional workshops with each vertical to help them understand how to use the new system effectively.
Outcomes
Increased site-wide revenue by more than 11% per user and engagement by more than 3%.
Drove 112.2 million returning users, the highest ever, 13% more than the previous year.
521.1 million daily active users, the highest ever.
Paradigm shift in users from “credit score = credit card offer” to “credit profile = opportunities to make progress.”
Influenced subsequent 7 billion dollar acquisition by Intuit.
Hypothesis
We believe delivering targeted, personalized content on the dashboard will ease member discovery of relevant tools and services, improve contextual navigation, and create feedback loops to drive engagement.
Assumptions
Users will scroll
Data can be effectively leveraged on render
Personalization will be instantly clear
Internal business verticals can orient around targeted traffic instead of volume
Deeper engagement will lead to diversified revenue streams
Scope of Work
Navigation to the 9 business verticals, giving users with intent a clear, recoverable way to get to their destination.
Stories, an intelligent and dynamic system of personalized insights that contextualize actions to facilitate deeper discovery and engagement.
Frames Manager, an engineering infrastructure to power Stories with an internal CMS that enables businesses to develop, test, and launch Stories.
Research
4 foundational studies; 50 users; 10 cities
3 concept tests; 40 users
2 surveys; 220k respondents
Continuous rapid prototyping, user testing, and experimentation
Learnings
-
We learned: Participants preferred to see their relevant personal information first, which helped them contextualize the content that followed.
-
We learned: Participants identified the amount of information that was “just right” and thought much more would be “overwhelming.” When prompted, participants said they did not see Stories as a feed.
-
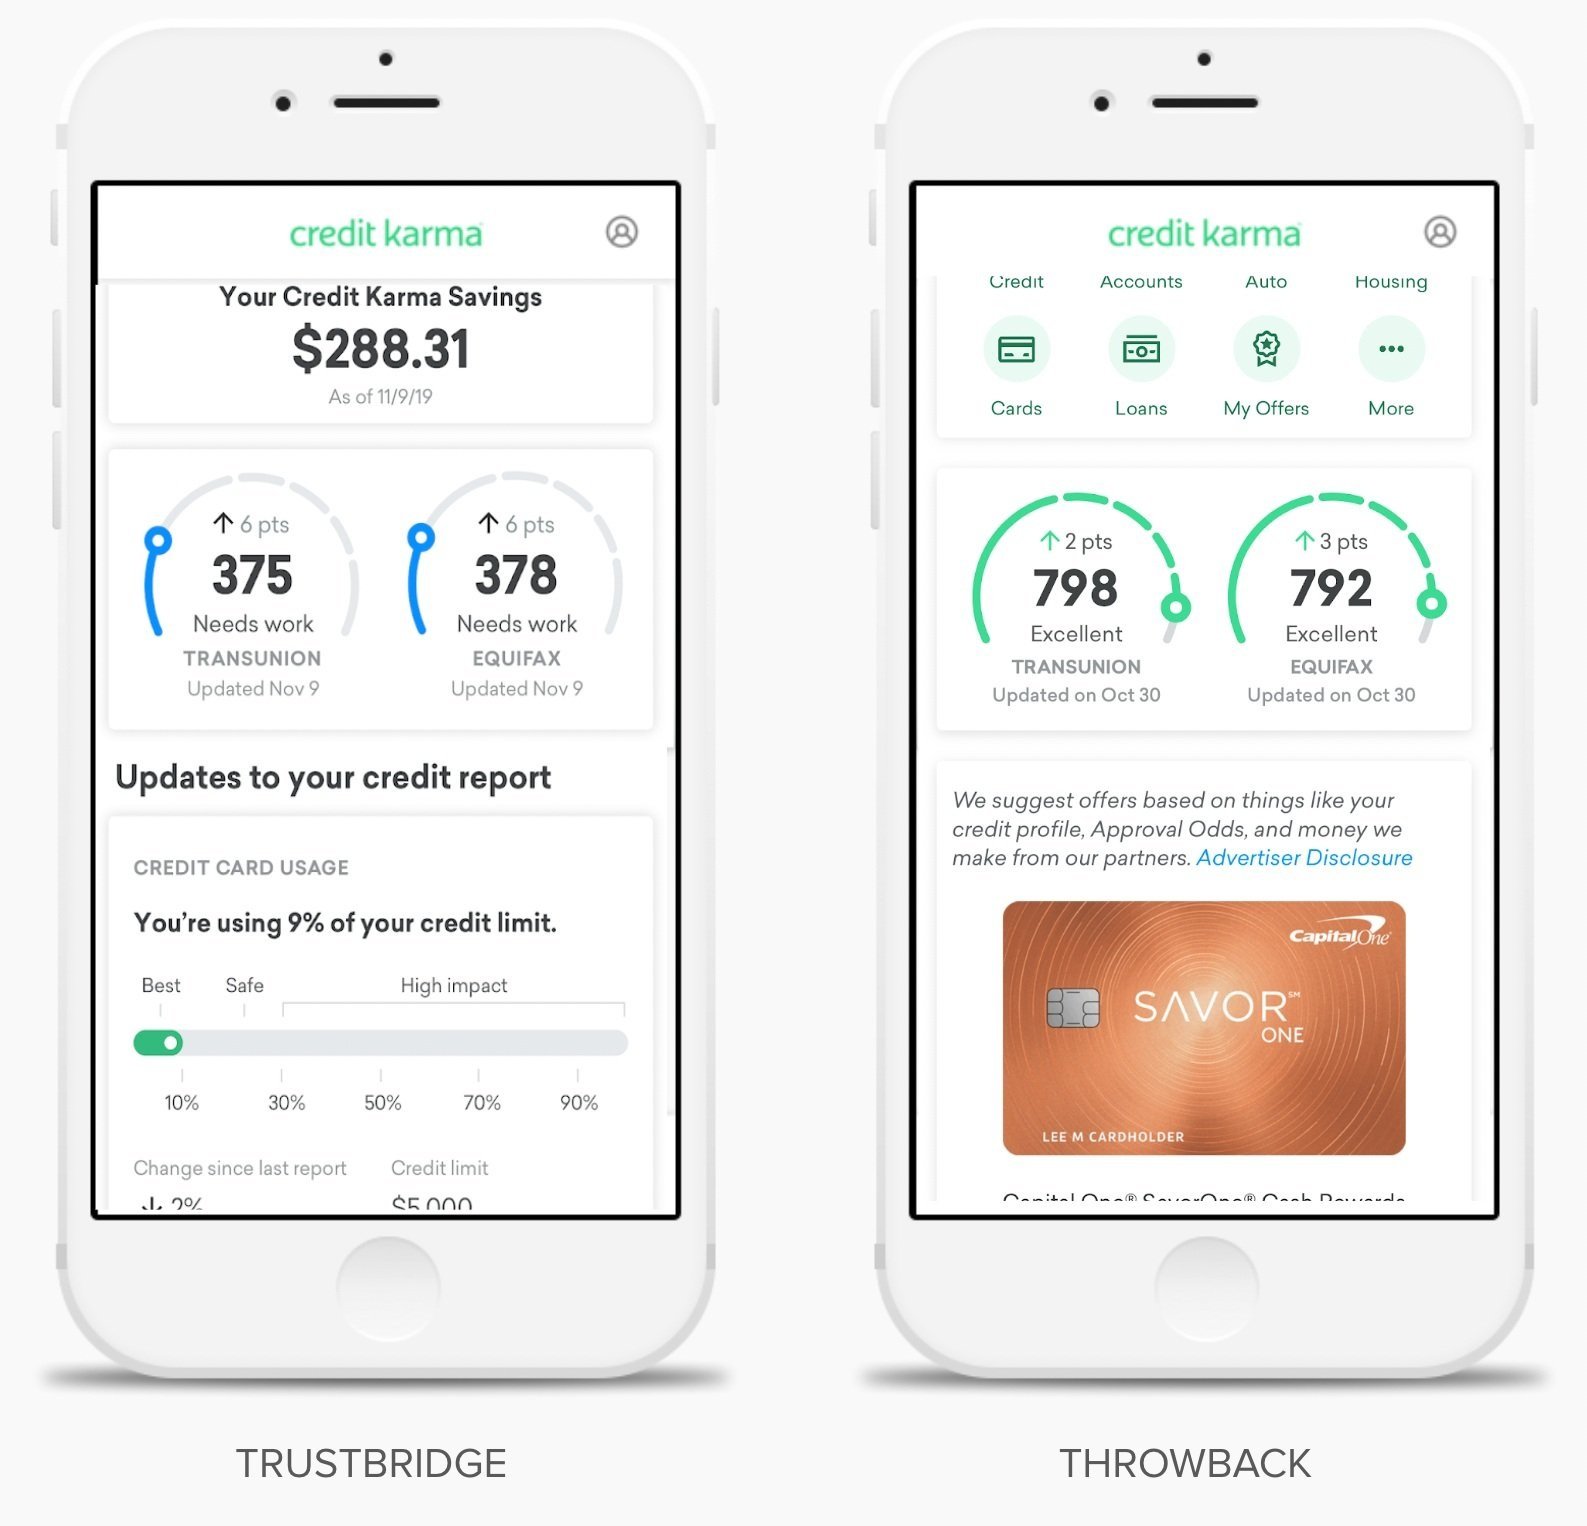
We learned: Participants were more likely to say the credit card offer was personalized to them in the “Trustbridge” variant where it was placed lower on the surface.
The “Trustbridge” and “Throwback” Variants
Designing the “Stories” experience
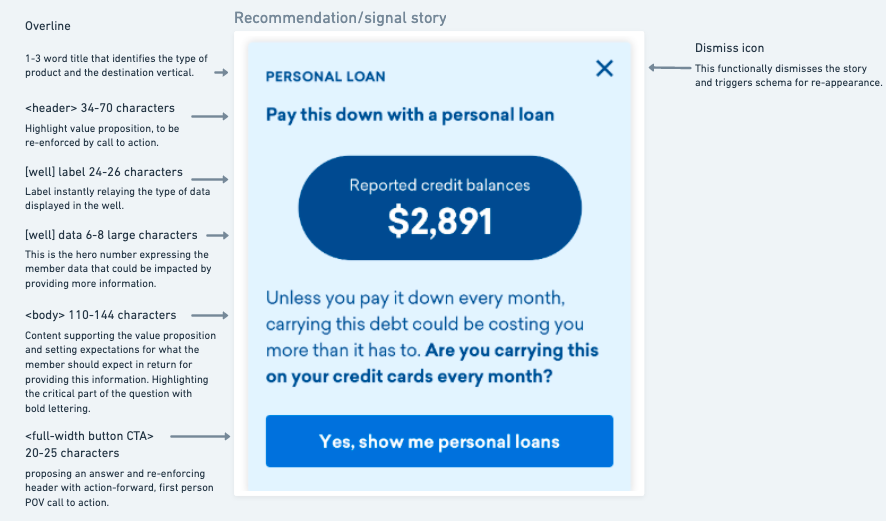
The Anatomy of a “Story”
Once we understood what users valued, we wanted to define how to best present Stories
Stories content system
Governance and principles
Content strategy
Stories Content System
Using credit report data, we were able to generate highly personalized “stories” that our recommendation engine could surface to users to engage them in deeper features.
Stories are modular “cards” designed to help members discover specific ways they could make financial progress and to self-select the most relevant experiences.
Structuring the new surface
Architecture of the dynamic stories dashboard.
Content Modeling
Story Types
By surfacing the information users come to the product for first, along with a set of similar monitoring insights from their personal finances, we kept users on page longer and they engaged with opportunities that were contextually aligned with the insights.
Data Monitoring Story
Show users where they stand and what they can do about it.
Recommendation Story
Uses eligibility triangulation, surfaces personalized information, makes a substantiated data claims and provides a clear value proposition.
Signal Story
A way to ask users direct questions to determine intent.
Feature Discovery
A swimlane of broader, more generic opportunities.
Frames Manager;
The Stories Publishing Platform
We developed novel “containers” technology to power Stories and an authoring tool so teams could develop, test and publish Stories to the dashboard.
Outcomes
Sitewide revenue-per-user lift from stories was +11%
Revenue lift across emergent verticals: +41.2% Auto, +23.3% Loans
Launched more than 30 Stories across verticals resulting in an incremental revenue contribution of $3.9M in Q2
11.2 million members see stories per month
3.1% DAU lift on iOS translates to 1.8m more visits per month
1.7% weekly retention lift on iOS translates to 170k more members logging in each week
Initial roll out indicated a 3.1% increase in engagement across the app
Q2 2020 Stories drove the highest ever returning users of 112.2M, up 2% QoQ and up 13% YoY
Highest ever daily active users at 521.1M
Expected to translate to an additional 1.8 million iOS visits per month


